GROWTH OR DEVELOPMENT
Humanising Water Security
M. Dinesh Kumar, Executive Director, Institute, for Resource Analysis and Policy Hyderabad 5/30/2011 4:09:36 AM
 As water scarcity hits many developing regions of the world, there is now a renewed interest in understanding how growing threats to water security affects future progress in human development and economic growth of nations (Grey and Sadoff, 2005). The international development debate is, however, heavily polarized between those who believe that policy reforms in the water sector would be crucial for bringing about progress in human development and those who believe that economic growth itself would help solve many of the water problems, which countries are facing today (HDR, 2006: pp66). Such debates, that are often not healthy, are causing delays in deciding investment priorities in water sector, particularly in the developing world (Biswas and Tortajada, 2001).
The theoretical discussion on the returns on investment by countries in water infrastructure and institutions is rich (Sadoff and Grey, 2005). The evidence available internationally to the effect that water security can catalyze human development and growth is quite robust ( World Bank, 2004; 2006a & b; Briscoe, 2005). But, the number of regions for which these are available is too small for evolving a global consensus on this complex issue. Till recently, there were no comprehensive database on various factors 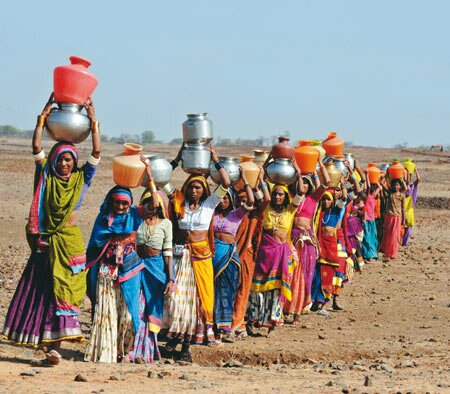 influencing water security for sufficient number of countries which are at different stages of human development and economic growth. This contributed to the complexity of the debate. The water poverty index (WPI), conceived and developed for countries by C. Sullivan (2002), and the international comparisons now available from a recent work by Laurence, Meigh and Sullivan (2003) for 145 countries enable us to provide an empirical basis for enriching the debate.
The WPI is a composite index consisting of five sub-indices, viz., water access index, water use index, water endowment index, water environment index and institutional capacities in water sector (Sullivan, 2002). In order to realistically assess the water situation of a country, which can capture the crucial attributes like access to water for various uses; level of use of water in different sectors; condition of the water environment; and technological and institutional capacities in water sector, a new index called Sustainable Water Use Index (SWUI) is derived from WPI. The paper provides empirical analysis using global database on SWUI and many other water and development indicators to enrich the debate “how water security is linked to human development and economic growth”.
The Global Debate on Water, Development and Growth
The debate on the linkage between water, growth and development is growing strong internationally. While the general view of international scholars, who support large water resource projects, is that increased investment in water projects such as irrigation, hydropower and water supply and sanitation acts as engines of growth in the economy, while supporting progress in human development (Briscoe, 2005; Braga, 2005; HDR, 2006). They harp on the need for investment in water infrastructure and institutions. Grey and Sadoff (2005) suggests that there is a minimum platform of water security, achieved through the right combination of investment in water infrastructure and institutions and governance, which is essential if poor countries are to use water resources effectively and achieve rapid economic growth to benefit vast numbers of their population. They suggest an S-curve for growth impacts of investment in water infrastructure and institutions in which returns continue to be nil for early investments. They argue that for poor countries, which experience highly variable climates, the level of investment required to reach the tipping point of water security1 would be much higher as compared to countries, which fall in temperate climate with low variability. But, they suggest that for developing countries, the returns on investment in infrastructure would be higher that in management and vice versa for developed countries.
Many environmental groups, on the other hand, advocate small water projects which, according to them, the communities can themselves manage. The solutions advocated are: watershed management; small water harvesting interventions; and community-based water supply systems; and, micro-hydro electric projects (Dharmadhikary, 2005; D’Souza, 2002).
The proponents of sustainable development paradigms believe that the ability of a country to sustain its economic growth depends on the extent to which natural resources, including water, are put to efficient use through technologies and institutions, thereby reducing the stresses on environmental resources (Pearce and Warford, 1993). Here, the focus is on initiating institutional and policy reforms in water sector. An alternative view suggests that countries would be able to tackle their water scarcity and other problems relating to water environment at advanced stages of economic development (Shah and Koppen, 2006). They argue that standard approaches to water management in terms of policies and institutions work when water economies become formal, which are found at an advanced stage of economic development of nations.
Objectives, Hypothesis, Methods and Data Sources
The objectives of the paper are to: (i) analyse the nature of linkage between water situation of a country, comprising improved water access and use, water environment and institutional capacities in the water sector, and economic growth of a nation; and (ii) understand the role of large water storages in boosting economic growth and changing human development indicators of countries which fall in hot and arid, tropical climates.
 We have three propositions. First: improving the water situation through investments in water infrastructure, institutions and policies would help ensure economic growth through the human development route. Second: nations can achieve reasonable progress in human development even at low levels of economic growth, through investment in water infrastructure, and welfare policies. Third: countries need to invest in building large water storages to support economic prosperity, and ensure water security for social advancements. The hypotheses are: (i) improved water situation supports economic growth through the human development route; and (ii) countries, which are in tropical climates with aridity, can support their economic growth through enhancing per capita reservoir storage that improves their water security.
The values of Sustainable Water Use Index were calculated by adding up the values of four of the sub-indices of Water Poverty Index, viz., water access index, water use index, water environment index and water capacity index.
The first hypothesis is tested using a regression of global data on: Sustainable Water Use Index (SWUI), and data on per capita GDP (PPP adjusted); SWUI and GHI; and SWUI and HDI. Since regression between SWUI and HDI showed a strong relationship (R2= 0.79), the causality, i.e., whether SWUI influences GDP growth or vice versa, can be tested by running regression between per capita GDP and a decomposed HDI, which contain the indices for health and education. The underlying premise is that if economic growth drives water situation, then it should change the indicators of human development that are independent of income levels, such as health and education, and that which are inter-related with water situation. The second hypothesis is tested by analysing the link between per capita GDP (PPP adjusted) and per capita dam storage (m3/annum) of 22 selected countries falling in hot and arid tropical climate.
Data on per capita GDP and HDI were obtained from Human Development Report 2006. Data on GHI2 for 117 countries were obtained from Wiesmann Doris (2007). Data on WPI for 145 countries were obtained from Laurence et al. (2003). Data on dam storage and human population in 22 countries were obtained from FAO AQUASTAT-2006.
Water and Inclusive Growth
Before we begin to answer this complex question of “what drives what”, we need to understand what realistically represents the water richness or water poverty of a country. A recent work by Kellee Institute of Hydrology and Ecology which came out with international comparisons on water poverty of nations had used five indices, viz., water resources endowment; water access; water use; capacity building in water sector; and water environment, to develop a composite index of water poverty (Laurence, Meigh and Sullivan, 2003).
Among these five indices, we chose four indices to be important determinants of water situation of a country and the only sub-index we excluded is the water resources endowment. We consider that this sub-index is more or less redundant, as three other sub-indices viz., water access, water use and water environment take care of what the resource endowment is expected to provide. Our contention is that natural water resource endowment becomes an important determinant of water situation of a country only when governance is poor and institutions are ineffective, adversely affecting the community’s access to and use of water, and water environment. Examples are the droughts in Sub-Saharan African countries. This argument is validated by a recent analysis which showed strong correlation between rainfall failure and economic growth performance in these countries. That said, all the four sub-indices we chose significant implications for socio-economic conditions and are influenced by institutional and policy environment and therefore have human element in them. Hence, such a parameter will be appropriate to analyse the effect of institutional interventions in water sector on economy.
All the sub-indices have values ranging from 0 to 20. The composite index developed, by adding up the values of these indices, is called sustainable water use index (SWUI). It is being hypothesised that the overall water situation of a country (or SWUI) has a strong influence on its economic growth performance. This is somewhat different from the hypothesis postulated by Shah and Koppen (2006), where in they have argued that economic growth (GDP per capita) and HDI are determinants of water access poverty and water environment.
It is important to provide empirical evidence to this. Worldwide, experiences show that improved water situation (in terms of its access to water; levels of use of water; the overall health of water environment; and enhancing the technological and institutional capacities to deal with sectoral challenges) leads to better human health and environmental sanitation; food security and nutrition; livelihoods; and greater access to education for the poor (UNDP, 2006). This aggregate impact can be segregated with irrigation having direct impact on rural poverty (Bhattarai and Narayanamoorthy, 2003; Hussain and Hanjra, 2003); irrigation having impact on food security, livelihoods and nutrition (Hussain and Hanjra, 2003), with positive effects on productive workforce; and domestic water security having positive effects on health, environmental sanitation, with spin off effects on livelihoods and nutrition (positive), school drop out rates (negative) and productive workforce.
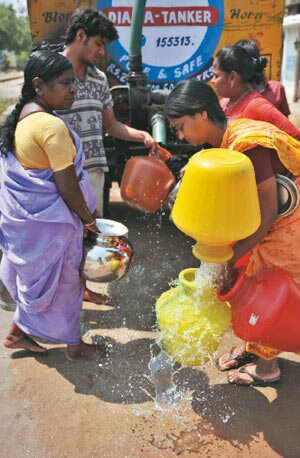
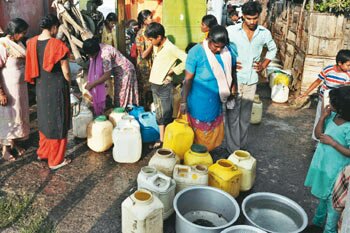
According to the Human Development Report (2006), only one in every five people in the developing world has access to an improved water source. Dirty water and poor sanitation account for vast majority of the 1.8 million child deaths each year (almost 5,000 every day) from diarrhea making it the second largest cause of child mortality. In many of the poorest countries, only 25% of the poorest households have access to piped water in their homes, compared with 85% of the richest. Diseases and productivity losses linked to water and sanitation in developing countries amount to two percent of GDP, rising to five percent in Sub-Saharan Africa more than the aid the region gets. Women bear the brunt of responsibility for collecting water, often spending up to four hours a day walking, waiting in queues and carrying water; water insecurity linked to climate change threatens to increase malnutrition to 75–125 million people by 2080, with staple food production in many Sub-Saharan African countries falling by more than 25%.
The strong inverse relationship between SWUI and the global hunger index (GHI), developed by IFPRI for 117 countries provide a broader empirical support for some of the phenomena discussed above. In addition to these 117 countries for which data on GHI are available, we have included 18 developed countries. For these countries, we have considered zero values, assuming that these countries do not face problems of hunger. The estimated R square value for the regression between SWUI and GHI is 0.60. The coefficient is also significant at one percent level. It shows that with improved water situation, the incidence of infant mortality (below five years of age) and impoverishment reduces. In that case, improved water situation should improve the value of human development index, which captures three key spheres of human development such as health, education and income status.
That said all the sub-indices of HDI have strong potential to trigger growth in economy of a country, be it educational status; life expectancy; or income levels. When all these factors improve, they could have a synergetic effect on the economic growth. The growth which occurs from human development, would also be “broad-based” and inclusive. Hence, the “causality” of water as a prime driver for economic growth can be tested if we are able to establish correlation between water situation and HDI. This we would examine at a later stage.
Before that, we would first look at how water situation and economic growth of nations are correlated. Regression between sustainable water use index (SWUI) and PPP adjusted per capita GDP for the set of 145 countries shows that it explains level of economic development to an extent of 69 percent. The coefficient is significant at one percent level. The relation between SWUI and per capita GDP is a power function. Any improvement in water situation beyond a level of 50 in SWUI, leads to exponential growth in per capita GDP.
This only means that for countries to be on the track of sustainable growth path, the following steps are needed: (i) investment in infrastructure and institutional mechanisms and policies to: (a) improve access to water for all sectors of use and across the board, (b) enhance the overall level of use of water in different sectors, and (c) regulate the use of water, reduce pollution and provide water for ecological services; and (ii) investment in building human resources and technological capabilities in water sector to tackle new challenges in the sector. Regression with different indices of water poverty against economic growth levels shows that the relationship is less strong, meaning all aspects (water access, water use, water environment and water sector capacity) are equally important to ensure growth.
Major variations in economic conditions of countries having same levels of SWUI, can be explained by the economic policies of which the country pursues. Some countries of central Asia viz., Uzbekistan, Kyrgyzstan and Turkmenistan and Latin American countries viz., Ecuador, Uruguay, Colombia and Chile have values of SWUI as high as North America and northern European countries, but are at much lower levels of per capita GDP. While North America and north, west and southern European countries have capitalist and liberal economic policies, these countries of old soviet block and Latin America have socialist and welfare oriented policies.
Can Water Security Ensure Economic Growth?
International development discussions are often characterised by polarised positions on whether money or policy reform is more crucial for progress in human development (various authors as cited in HDR, 2006: pp 66). If the stage of economic development determines a country’s water situation rather than vice versa, the variation of human development index, should be explained by variation in per capita GDP, rather than water situation in orders of magnitude. We have used data for 145 countries to examine this closely. The regression shows that per capita GDP explains HDI variations to an extent of 85 percent. But, it is important to remember that HDI already includes per capita income, as one of the sub-indices.
 Therefore, analysis was carried out using decomposed values of HDI index, after subtracting the GDP index. The regression value came down to 0.69 (R2=0.69) when the decomposed index, which comprises education index and life expectancy index, was run against per capita GDP. What is more striking is the fact that 16 countries having per capita income below 2,000 dollars per annum have medium levels of decomposed index. Again 42 countries having per capita GDP (PPP adjusted) less than 5,000 dollars per annum have medium levels of decomposed HDI. Significant improvements in HDI values (0.30 to 0.9) occur within the small range in per capita GDP. The remarkable improvement in HDI values with minor improvements in economic conditions, and then “plateauing” means that improvement in HDI is determined more by factors other than economic growth. Our contention is that the remarkable variation in HDI of countries belonging to the low income group can be explained by the quality of governance in these countries, i.e., whether good or poor.
Many countries that show high HDI also have good governance systems and practices and institutional structures to ensure good literacy and public health. For instance, Hungary in eastern Europe; some countries of Latin America viz., Uruguay, Guatemala, Paraguay, Nicaragua and Bolivia; and countries of erstwhile Soviet Union viz., Turkmenistan, Kyrgykistan and Armenia have welfare-oriented policies. They make substantial investment in water, health and educational infrastructure.3
Incidentally, many countries, which have extremely low HDI, have highly volatile political systems and ineffective governance, and are characterized by corruption in government. In spite of huge external aid, consequently, the investments in building and maintenance of water infrastructure are very poor in these countries. Sub-Saharan African countries, viz., Angola, Benin, Chad, Eritrea, Ethiopia, Burundi, Niger, Togo, Zambia and Zimbabwe; and Yemen from Middle East belong to this category. Sub-Saharan Africa has the lowest irrigated to rain-fed area ratio of less than three percent (FAO, 2006, pp 177), where as Ethiopia has the lowest water storage of 20m3/capita in dams (World Bank, 2005). How water security decoupled human development and economic growth in many regions of the world were illustrated in the recent human development report (HDR, 2006: pp 30-31).
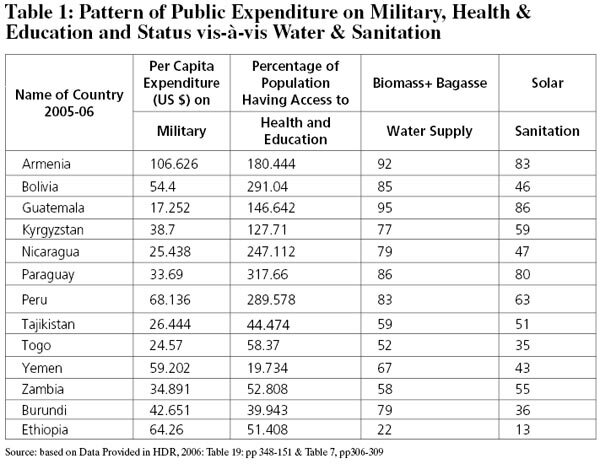
The public expenditure on health and education is extremely low in these African countries and Yemen when compared to the many other countries which fall under the same economic category (below US $ 5,000 per capita per annum). Over and above, the pattern of public spending is more skewed towards military (Table 1 based on data provided in HDR, 2006, pp 348-351). Besides, access to water supply and sanitation is much higher in the countries which have higher HDI, as compared to those countries which have very low HDI (based on data in HDR, 2006, pp306-309).
Some of the striking features of these regions are high incidence of water related diseases such as malaria and diarrhea, high infant mortality, high school drop out rate mainly due to lack of access to safe drinking water; and scarcity of irrigation water in rural areas4, poor agricultural growth, high food insecurity and malnutrition (based on HDR, 2006). Consequently, their HDI is very low, as also shown by the international literature which illustrates how water insecurity decouples human development from economic growth.
Linking Human Development with Water Security
Contrary to what was seen in the foregoing analysis, regression between sustainable water use index and HDI shows that it explains variation in HDI in a much better way than the level of economic development. This is in spite of the fact that human development index as such does not include any variable that explicitly represents access to and use of water for various uses; overall health of water eco-system; and capacities in the water sector as one of its sub-indices. The R square value was 0.79 against 0.69 in the earlier case when per capita GDP is run against decomposed HDI. Also, the coefficient is significant at one percent level. It means that variation in human development index can better be explained by water situation in a country, expressed in terms of sustainable water use index, than the PPP adjusted per capita GDP. Now, such a strong linear relationship between sustainable water use index and HDI explains the exponential relationship between sustainable water use index and per capita GDP as the improvements in sub-indices of HDI contributes to economic growth in its own way (i.e., per capita GDP=f(E1,HI) here E1 is the education index, and HI is the health index).
While an alternative to analyse the impact of a country’s water situation on its economic growth performance is to look at the historical data on: cumulative investments in water sector, water access and use by population in different sectors, change in water environment and economic conditions for individual nations, such data are seldom available on a time series basis. Under such a circumstance, the best way to go ahead is to analyse the impact of natural water endowment, i.e., rainfall on economic growth in a situation where investments in infrastructure and institutions and governance mechanisms for improving water access and use and water environment are poor. The reason is that under such situations, the water access, water use, and water environment would be highly dependent on natural water endowment.
There cannot be a better region than Sub-Saharan Africa to illustrate such effects. A recent analysis showed a strong correlation between rainfall trend since 1960s and GDP growth rates in the region during the same period, which argued that the low economic growth performance could be attributed to long term decline in rainfall which the region experienced (Barrios et al., 2004). Such a dramatic outcome of rainfall failure can be explained partly by the failure of the governments to build sufficient water infrastructure. Sub-Saharan Africa has smallest proportion of its cultivated area (< 3%) under irrigation (HDR, 2006). Due to this reason, reduction in rainfall leads to decline in agricultural production, food insecurity, malnutrition, loss of employment opportunities and an overall drop in economic growth in rural areas.
The foregoing analyses suggest that improving sustainable water use index, which is reflective of how good is the water situation of a country, is of paramount importance if we need to achieve inclusive growth in a sustained manner. It would be rather improper to assume that a country can wait till its economy improves to a certain level to start tackling its water problems. While the natural water endowment in both qualitative and quantitative terms cannot be improved through ordinary measures, the water situation can be improved through economically efficient, just and ecologically sound development and use of water in river basins.
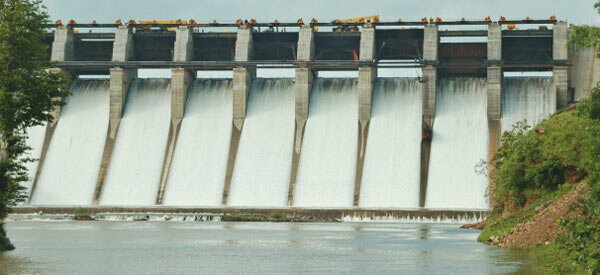
Impact of Storage Development in Economic Growth in Arid Tropics
Water development has an important role in improving the access to and use of water, the two pre-requisites for improving the water situation of a region, though intensive water development in river basins might cause environmental water stress reducing the values of water environmental index. However, the amount of storage that needs to be created to improve access to and use of water depends on the type of climatic conditions. In temperate and cold climates, the demand of irrigation, the largest water use sector, would be negligible as compared to tropical and hot climates. Hence, the storage requirements in such regions would be much lower, and would be mainly limited to that for meeting domestic/municipal water needs and water for manufacturing. Therefore, it is logical to explore links between storage development for meeting various human needs and economic growth only in tropical and hot climates.
But, as indicated in the Human Development Report of 2006, the sheer scale of water infrastructure in rich countries is not widely recognized and appreciated (HDR, 2006: pp-155). Many developed countries of the world that experience tropical climates had high water storage in per capita terms. The United States, for instance, had created a per capita storage capacity of nearly 6000 m3. In Australia, the 447 large dams alone create a total storage of 79,000 MCM per annum, providing per capita water storage of nearly 3,808 m3 per annum. Aquifers supply another 4,000 MCM per annum. China, the fastest growing economy in the world, has a per capita reservoir storage capacity of 2,000 m3 per annum through dams, and an actual storage of nearly 360m3 per capita.
When compared to these impressive figures, India, which is still developing, has a per capita storage of only 200m3 per annum. Though a much higher level of withdrawal of nearly 600 m3 per capital per annum is maintained by the country, a large percentage of this (231 BCM per annum or nearly 217 m3 per capita per annum) comes from groundwater draft and there are increasing evidence to suggest that this won’t be sustainable5. Ethiopia, the poorest country in the world, has a per capita storage of 20 m3 per annum. These facts also strengthen the argument that economic prosperity that a country can achieve is a function of available per capita water storage.
 Regression analysis of per capita water storage and the per capita GDP (PPP adjusted) for a group of 22 countries falling in the arid and semi arid tropics shows a strong relationship between level of storage development and country’s economic prosperity. The R square value is 0.55 and the coefficient is significant at one percent level. Such a relationship is understandable. Storage infrastructure reduces risks and improves water security. In many regions, investments in hydraulic infrastructure had supported economic prosperity and social progress, though in some regions had caused environmental damage (HDR, 2006, based on various authors: pp140)6.
The returns on investments in building water storages were quite visible in India. The analysis using panel data on gross irrigated area and rural poverty rate for 14 states showed poverty reducing effect of irrigation, with lowest rate of poverty found in Punjab which had the highest level of gross irrigated area, which reduced over time from 1973-74 to 1993-94 (Bhattarai and Narayanamoorthy, 2003). The Bhakra-Nangal Project had transformed the economy of Punjab. The almost perennial water supply from the project enabled farmers in this region to intensify cultivation with irrigated paddy and wheat, making it the country’s bread basket.7 In Gujarat state of western India, the impact of the yet to be completed Sardar Sarovar project (SSP) in reviving the agricultural production, after it experienced a major dip following two consecutive years of drought (1999 and 2000), has been remarkable (Kumar et al., 2010). The project which brings water from the water-rich south Gujarat, to the water-scarce regions of north Gujarat, Saurashtra and Kachchh, reduces the imbalances in water availability and demand in different regions of the state.
The potential positive impact of water infrastructure on economic growth in regions that experience seasonal climates, rainfall variability and floods and droughts can be better demonstrated by the economic losses that water-related natural disasters cause in the regions which lack them (Kumar, 2009). For instance, in Ethiopia, deviation in per capita GDP from the normal values during the 20-year period from 1980-2000 correlated with departure of annual rainfall from normal values (World Bank, 2006a). In Kenya, economic losses due to floods during 1997-98 were to the tune of 11% of the national GDP, where as that due to droughts during 1998-2000 was 16% of the GDP (World Bank, 2004a and World Bank 2006b). In Gujarat, value of agricultural output dropped from Rs. 268.37 billion in 1998-99 to Rs. 189.0 billion in 2000-01 following the droughts in 1999 and 2000 (Kumar et al., 2010: pp 4).
Nevertheless, the overall economic growth impact of water storage would depend on the nature of uses for which the resources are developed, the effectiveness of the institutions that are created to allocate the resource and the nature of institutional and policy regimes that govern the use of the resource. As we have seen in the case of incidence of hunger in Zambia and Zimbabwe, use of water storages for hydropower generation had not helped even to improve the overall economic condition of the people (Kumar, 2009). Though the per capita water storage in Israel is quite low (nearly 150 m3 per annum), the efficiency with which water is used in different sectors is extremely high. Nearly 90% of the country’s irrigated area is under micro irrigation systems. A large portion of the water used in urban areas is recycled and put back to use for irrigation. Water is not only priced on volumetric basis, water allocation for irrigation is rationed (Kumar, 2009).
One could as well argue that access to water could be better improved through local water resources development intervention including small water harvesting structures, or through groundwater development. As a matter of fact, environmental activists advocate decentralized small water harvesting systems as alternatives to large dams (Agarwal and Narain, 1997). Small water harvesting systems had been suggested for water-scarce regions of India (Agarwal and Narain, 1997; Athavale, 2003) and the poor countries of Sub-Saharan Africa (Rockström et al., 2002). But, recent evidence suggest that they cannot make any significant dent in increasing water supplies in countries like India due to the unique hydrological regimes and can also prove to be prohibitively expensive in many situations (Kumar et al., 2006; Kumar et al., 2008). Also, to meet large concentrated demands in urban and industrial areas, several thousands of small water harvesting systems would be required. The type of engineering interventions8 and the economic viability of doing the same are open to question. Recent evidence also suggests that small reservoirs get silted up much faster than the large ones (Vora, 1994), a problem for which large dams are criticised world over (McCully, 1996).
As regards groundwater development, intensive use of groundwater resources for agricultural production is proving to be catastrophic in many semi arid and arid regions of the world, including some developed countries like Spain, Mexico, Israel, Australia, and parts of United States (Kumar, 2007) and developing countries such as India, China, Pakistan, Yemen and Jordan (HDR, 2006), though some of the developed countries have achieved some degree of success in controlling it through establishment of management regimes (Kumar, 2007) with physical and institutional interventions like in western US, or through physical interventions alone like in Israel or through institutional interventions such as formal water markets like in the Murray Darling basin of Australia.
But in the basins facing problems of environmental water scarcity and degradation (Smakhtin, Revenda and Doll, 2004) due to large water projects, river-flows are appropriated and transferred for various consumptive needs. Some of these basins are the Colorado river basin in the western US; Yellow river basin in northern China; Aral sea basins, viz., Amu-Darya and Syr Darya in Central Asia; Indus basin in Pakistan and India; basins of northern Spain; Nile basin in northern Africa; basins of Euphrates, Tigris; the Jordan river; Cauvery, Krishna and Pennar basins of peninsular India; river basins of western India including Sabarmati, Banas and Narmada, located in Gujarat, Rajasthan and Madhya Pradesh in India. Most of the water demands they meet are agricultural9. They are also agriculturally prosperous regions. Not only they meet the food requirements of the region, most of these basins export significant chunk of the food to other regions of the world, including some of the water-rich regions, within the country’s territory (Amarasinghe et al., 2004 for Indus basin and peninsular region in India; Kumar and Singh, 2005 for many water-scarce countries of the world; Yang, 2002 for China).
Strikingly, wherever aquifers are available for exploitation, these regions had experiencing problems of groundwater over-draft, though some developed countries had developed the science to deal with it. The most glaring examples are aquifers in western United States, aquifers in the countries of the Middle East including Yemen, Iran and Jordan; aquifers in Mexico; north China plains (Molden et al., 2001); alluvial aquifers of Indus basin areas in India; hard rock aquifers of Peninsular India; and aquifers in western and central India (GOI, 2005).
Without these large surface water projects, agricultural growth might have caused far more serious negative impact on groundwater resources in these regions. In fact, it is this surface water availability, which to a great extent helps reduce dependence of farmers as well as cities on groundwater (Kumar, 2009). For instance, imported water from Indus basin through canal in Indian and Pakistan Punjab sustain intensive groundwater use in the regions, through continuously providing replenishment through return flows from surface irrigation (Ahmed et al., 2004; Hira and Khera, 2002; Kumar, 2007). In India, water imported from a large reservoir named Sardar Sarovar in Narmada basin in Southern Gujarat in India had started supplying water to rejuvenate the rivers in environmentally stressed basins of north Gujarat (Kumar et al., 2010).
Impact of Storage Development on Malnutrition and Child Mortality
Storage development is found to have a direct impact on malnutrition, and infant mortality, the factors considered in estimating global hunger index, when we considered zero values of GHI for developed countries viz., United States, Australia and Spain for which data on GHI are not available (Kumar, 2009). Regression shows an R square value of 0.59. The relationship between per capita storage and GHI is inverse, logarithmic. It means greater water storage reduces the chances of human hunger. This inverse relationship can be explained this way. For the sample countries, the ability to cultivate the available arable land intensively would increase with the amount of water storage facilities available. As HDR (2006: pp 174) notes, “Water security in agriculture pervades all aspects of human development”. Increased availability of irrigation water reduces the risk of crop failure; enhances the ability of farmers to produce more crops to improve their own domestic consumption of food, and take care of the cash needs. Also, increased irrigated production improves food and nutritional security of the population at large by lowering cereal prices in the region in question as the gap between cereal demand and supplies is reduced (Hussain and Hanjra, 2003 as cited in HDR, 2006: pp 175).
 This was more evident in India than anywhere else, where irrigation expansion through large storages had contributed nearly 47 million tons of additional cereals to India’s bread basket (Perry, 2001: pp 104). The most illustrious example of the recent times is the impact of Sardar Sarovar project, which is yet to be completed on food production and agricultural growth in Gujarat. Availability of surface water through canals had motivated farmers in south and central Gujarat to take up paddy and wheat and achieve bumper food grain production in the recent years. Shah and Kumar (2008) made a rough estimate of the positive externality it created in terms of lowering food prices for the consumers in India as US $ 20 per ton of cereals. One could also argue that rich countries could afford to import food. But, what is important is that water had played a big role for these countries to achieve a certain level of economic growth and prosperity, by virtue of which they can now afford to import food instead of resorting to domestic production. The exceptions are some of the oil rich countries of the Middle East, which do not have an agrarian base, but are economically prosperous.
Contrary to what was found from our analysis of 22 countries, countries such as Zambia and Zimbabwe have large storages, but have very high GHI (Kumar, 2009). They were not included in our analysis. These countries use their water storages for creating hydro-power, which is sold to the South Africa, and they earn revenue out of it10. Hence, storage development does not lead to increased agricultural production in these countries. The GHI values are very high for these countries (Wiesmann, 2006). In such a situation, the impacts on food security would generally be seen only after many years. But in the case of these Sub-Saharan African countries, three decades of droughts and rainfall reduction had significantly affected the hydropower generation as well (McCully and Wong, 2004).
Summary, Conclusions and Policy
Scholars have provided robust evidence to the effect that water security catalyses human development and economic growth. But, number of regions for which the evidence is available is too limited to evolve a global consensus on this complex issue. Water poverty index, conceived and developed by C. Sullivan (2002), and the international comparisons now available from Laurence, Meigh and Sullivan (2003) for 147 countries enable us to provide an empirical basis for the argument. A new index called SWUI was derived from WPI using four of its five sub-indices to assess the water situation of a country. Analysis was carried out using data on SWUI, GHI, HDI, per capita GDP and per capita water storage in dams to understand the nature of linkage between water situation of a country and its economic growth.
The analysis shows that improving the water situation can trigger economic condition in a nation. As this occurs through the human development route, the growth would be inclusive. This strong linkage can be partly explained by the reduction in malnutrition and infant mortality, with improvement in water situation. Further, nations could achieve good indicators of development even at low levels of economic growth, through investment in water infrastructure and welfare-oriented policies. Many countries of the erstwhile Soviet Union, and communist countries of Latin America, which have low income, spend a significant portion of public funds in health and education, against many poor countries of Sub-Saharan Africa, which spend much less for health and education and more for military.
Countries which fall in tropical semi arid and arid climate can improve their economic conditions through enhancing the reservoir storage. Greater storage provides increased water security, which reduces the risks associated with droughts and floods. Such natural calamities, which cause huge economic losses, are characteristic of these countries. Nevertheless, the impact of storage could depend on the nature of uses for which the resources are developed, the effectiveness of the institutions that are created to allocate the resource and the nature of institutional and policy regimes that govern the use of the resource.
Findings show that economically poor countries, which also show very poor indicators of human development, need not wait till the economic conditions improve to address water sector problems. Instead, they should start investing in building water infrastructure, create institutions and introduce policy reforms in water sector that could lead to sustainable water use. Only, this can support progress in human development and sustain economic growth which is inclusive. But, a pre-requisite for hot and arid tropical countries is that they invest in large water resource systems to raise the per capita storage. This will help them fight hunger and poverty, malnutrition, infant mortality, and reduce the incidence of water-related disasters.
End-notes
1 Beyond which the investment in water infrastructure and institutions yields positive growth impacts.
2 Indicator of the proportion of the population living in under-nourished conditions and the child mortality rate (Wiesmann, 2006).
3 For instance, the USSR had invested in a major way for building hydraulic infrastructure in central Asia (HDR, 2006). As a result, they attain high HDI even at low level of economic growth.
4 This includes economic scarcity as well.
5 As discussed in a recent work by Kumar (2007), many semi arid areas are already facing problems of groundwater over-draft, with serious socio-economic and ecological consequences.
6 Since 1920, the US Army Corps of Engineers had invested a sum of
$ 200 billion on flood management and mitigation alone, yielding a benefit of $ 700 billion. The Tennessee Valley Authority, which built dams for hydropower, transformed a
flood-prone, impoverished region in the United States, with some of the worst human development indicators, into an agriculturally prosperous region. In Japan, heavy post war investments in infrastructure supported rapid development of hydropower, flood control and irrigated agriculture. The returns from these investments were tremendous. Until World Water II, the floods and typhoons had resulted in losses often amounting to 20% of GNI, whereas since
the 1970s, the losses never exceeded one percent of the GNI (HDR, 2006: pp 156).
7 Now, 90% of the cropped area in Punjab is irrigated, with paddy and wheat accounting for 3/4th of it. Despite having only less than two percent of the geographical area of the country, Punjab accounts for 10% of rice production and 20% of wheat production in India. Agriculture accounts for 40% of the state GDP in the state, which has the highest per capita GDP amongst all Indian states (Cummings et al., 2006).
8 Complex engineering interventions would be required for collecting water from such number of small water harvesting and storage systems, and then transporting to a distant location in urban areas.
9 In Murray Darling basin, 90% of the annual flows are diverted for agricultural use.
10 Most of it comes from just one hydropower dam, named, Kariba built in 1955-59 in Zambezi river basin.
References and Additional Thinking
Agarwal, Anil and Sunita Narain (1997) Dying Wisdom: Rise and Fall of Traditional Water Harvesting Systems, Centre for Science and Environment, New Delhi.
Ahmad, M. D., I, Masih and H. Turral (2004) Diagnostic analysis of spatial and temporal variations in crop water productivity: A field scale analysis of the rice-wheat cropping system of Punjab, Pakistan, Journal of Applied Irrigation Science, 39 (10).
Amarasinghe, Upali, Bharat R. Sharma, Noel Aloysius, Christopher Scott, Vladimir Smakhtin, Charlotte de Fraiture, A. K. Sinha and A. K. Shukla (2004) Spatial Variation in Water Supply and Demand across River Basins of India, IWMI Research Report 83, Colombo, Sri Lanka.
Athavale, R. N. (2003) Water Harvesting and Sustainable Supply in India, published for Environment and Development Series, Centre for Environment Education, Rawat Publications, Jaipur and New Delhi.
Barrios, Salvador, Luisito Bertinelli and Eric Strobl (2004) Rainfall and Africa’s Growth Tragedy, paper.
Bhattarai, Madhusudan and A. Narayanamoorthy (2003) Impact of irrigation on rural poverty in India: an aggregate panel data analysis, Water Policy, 5 (2003): 443-458.
Biswas, Asit K. and Cecilia Tortajada (2001) Development and large Dams: A Global Perspective, International Journal of Water Resources Development, 17 (1).
Braga B., O. Rocha and J. Tundisi (1998) Dams and the Environment: The Brazilian Experience, International Journal of Water Resources Development, 14 (2).
Briscoe, John (2005) “India’s Water Economy: Bracing up for a Turbulent Future,” key note address at the 4th Annual Partners’ Meet of IWMI-Tata Water Policy Research Program, Institute of Rural Management Anand, 26-29 February, 2005.
Cummings Jr. R., S. Rashid and A. Gulati (2006) Grain Price Stabilization Experiences in Asia: What Have We Learned?, Food Policy, 31 (4): 302-312.
Dharmadhikary, S. (2005) Unraveling Bhakra: Assessing the Temple of Resurgent India, Manthan Adhyayan Kendra, New Delhi.
Doris, Wiesmann (2006) Global Hunger Index: A basis for cross country comparison, International Food Policy Research Institute, Washington D. C.
D’Souza, D. (2002) Narmada Dammed: An Enquiry into the Politics of Development, New Delhi: Penguin Books India.
Food and Agriculture Organization of the United Nations (FAO) (2006) The AQUASTAT database. Rome. [www.fao.org/aq/agl/aglw/aquastat/dbase/index.stm]
Government of India (2005) Dynamic Ground Water Resources of India, Central Ground Water Board, Ministry of Water Resources, Government of India, August.
Hira, G. S. and K. L. Khera (2000) Water Resource Management in Punjab under Rice-Wheat Production System, Department of Soils, Punjab Agricultural University, Ludhiana.
Hussain, Intizar and Munir Hanjra (2003) “Does Irrigation Water Matter for Rural Poverty Alleviation? Evidence from South and South East Asia,” Water Policy, 5 (5): 429-442.
Human Development Report (2006) Human Development Report-2006, New York: United Nations.
Kumar, M. Dinesh (2007) Groundwater Management in India: Physical, Institutional and Policy Alternatives, New Delhi: Sage Publications.
Kumar, M. Dinesh (2009) Water Management in India: What Works, What Doesn’t, Gyan Books, New Delhi.
Kumar, M. Dinesh and Rahul Ranade (2004) Large Water Projects in The Face Of Hydro Ecological and Socioeconomic Changes in Narmada Valley: Future Prospects and Challenges, Journal of Indian Water Resources Society.
Kumar, M. Dinesh and O. P. Singh (2005) Virtual Water in Global Food and Water Policy Making: Is There a Need for Rethinking? Water Resources Management, 19: 759-789.
Kumar, M. Dinesh, Shatanu Ghosh, Ankit Patel, O. P. Singh and R. Ravindranath (2006) Rainwater Harvesting in India: some critical issues for basin planning and research, Land Use and Water Resource Research, 6 (2006): 1-17.
Kumar, M. Dinesh, A. Narayanamoorthy, OP Singh, MVK Sivamohan, Manoj Sharma and Nitin Bassi (2010) “Gujarat’s Agricultural Growth Story: Exploding Some Myths,” Occasional Paper # 2, Institute for Resource Analysis and Policy, Hyderabad.
Laurence, Meigh and C. Sullivan (2003) Water Poverty of Nations: International Comparisons, Kellee University, Wallingford, UK.
Mc Cully, Patrick (1996) Climate Change Dooms Dams, Silenced Rivers: The Ecology and Politics of Large Dam, Zed Books, London.
Mc Cully, Patrick and Susanne Wong (2004) Powering a Sustainable Future: The Role of Large Hydropower in Sustainable Development, paper prepared for the UN Symposium on Hydropower and Sustainable Development.
Molden, D. J., Upali Amarasinghe and I. Hussain (2001) “Water for Rural Development, “Working Paper 32, International Water Management Institute, Colombo.
Pearce, D. W. and Warford, J. (1993) World Without End: Economics, Environment, and Sustainable Development. (published for the World Bank) London and New York: Oxford University Press.
Perry, C. J. (2001) World Commission on Dams: Implications for Food and Irrigation, Irrigation and Drainage, 50: 101-107.
Rockström, J., Jennie Barron and Patrick Fox (2002) Rainwater management for improving productivity among small holder farmers in drought prone environments, Physics and Chemistry of the Earth, 27 (2002): 949-959.
Sadoff, Claudia and David Grey (2005) “Water Resources, Growth and Development,” a Working Paper for Discussion, prepared by The World Bank for the panel of Finance Ministers, the UN Commission for Sustainable Development, 18 April, 2005.
Shah, Tushaar and Barbara van Koppen (2006) Is India Ripe for Integrated Water Resources Management? Fitting Water Policy to National Development Context, Special Articles, Economic and Political Weekly, August 5, 2006.
Shah, Zankhana and M. Dinesh Kumar (2008) In the Midst of the Large Dam Controversy: Objectives, Criteria for Assessing Large Water storages in Developing World, Water Resources Management, 22: 1799-1824.
Smakhtin, Vladimir, Carmen Revenda and Petra Doll (2004) “Taking into Account Environmental Water Requirements in Global-Scale Water Resources Assessments,” Comprehensive Assessment Report 2, Comprehensive Assessment Secretariat, Colombo.
Sullivan, Caroline (2002) Calculating Water Poverty Index, World Development, 30 (7): 1195-1211.
Vora, B. B. (1994) Major and Medium Dams: Myth and the Reality, Hindu Survey of the Environment, The Hindu, Chennai.
World Bank (2004) Towards a Water Secure Kenya: Water Resources Sector Memorandum, Washington D. C.
World Bank (2005) “Pakistan Water Economy: Running Dry”, Report 34081-PK. South Asia Region, Agriculture and Rural Development Unit, Washington D.C.
World Bank (2006a) Managing Water Resources to Maximize Sustainable Growth: A Country Water Resources Assistance Strategy for Ethiopia, Washington D. C.
World Bank (2006b) Hazards of Nature, Risk to Development, An IEG Evaluation of World Bank Assistance to Natural Disasters, Independent Evaluation Group, Washington D. C.
(M. Dinesh Kumar is a Ph. D in Water Management. He had worked with engineering consultancy organizations, national and international research/academic institutions and NGOs, and had worked very closely with many reputed international and national agencies, viz., UNICEF, the Ford Foundation, the International Development Research Centre (IDRC), the Aga Khan Foundation, New Delhi, Sir Ratan Tata Trust, Mumbai and Arghyam, Bangalore. He is currently the Executive Director of Institute for Resource Analysis and Policy (IRAP). He has nearly 120 publications to his credit, including three books; one edited volume; many book chapters; and several papers in international peer-reviewed journals.
The views expressed in the write-up are personal and do not re?ect the official policy or position of the organization.)
<
|
| |
|
| |
|
|
*
|
| Name: |
* |
| Place: |
* |
| Email: |
* *
|
| Display Email: |
|
| |
|
| Enter Image Text: |
|
| |
|